

Satellite communications provider Globalstar (NASDAQ:GSAT) reported revenue ahead of Wall Streets expectations in Q3 CY2025, with sales up 2.1% year on year to $73.85 million. The company’s full-year revenue guidance of $272.5 million at the midpoint came in 2.9% above analysts’ estimates. Its GAAP loss of $0.01 per share was $0.02 above analysts’ consensus estimates.
Is now the time to buy Globalstar? Find out by accessing our full research report, it’s free for active Edge members.
Globalstar (GSAT) Q3 CY2025 Highlights:
- Revenue: $73.85 million vs analyst estimates of $68.94 million (2.1% year-on-year growth, 7.1% beat)
- EPS (GAAP): -$0.01 vs analyst estimates of -$0.03 ($0.02 beat)
- Adjusted EBITDA: $37.57 million vs analyst estimates of $36.06 million (50.9% margin, 4.2% beat)
- The company reconfirmed its revenue guidance for the full year of $272.5 million at the midpoint
- Operating Margin: 13.8%, in line with the same quarter last year
- Free Cash Flow was -$69.38 million, down from $1.90 million in the same quarter last year
- Market Capitalization: $6.48 billion
Company Overview
Known for powering the emergency SOS feature in newer Apple iPhones, Globalstar (NASDAQ:GSAT) operates a network of low-earth orbit satellites that provide voice and data communications services in remote areas where traditional cellular networks don't reach.
Revenue Growth
Examining a company’s long-term performance can provide clues about its quality. Any business can put up a good quarter or two, but many enduring ones grow for years.
With $262.2 million in revenue over the past 12 months, Globalstar is a small player in the business services space, which sometimes brings disadvantages compared to larger competitors benefiting from economies of scale and numerous distribution channels. On the bright side, it can grow faster because it has more room to expand.
As you can see below, Globalstar’s sales grew at an incredible 15.6% compounded annual growth rate over the last five years. This is an encouraging starting point for our analysis because it shows Globalstar’s demand was higher than many business services companies.
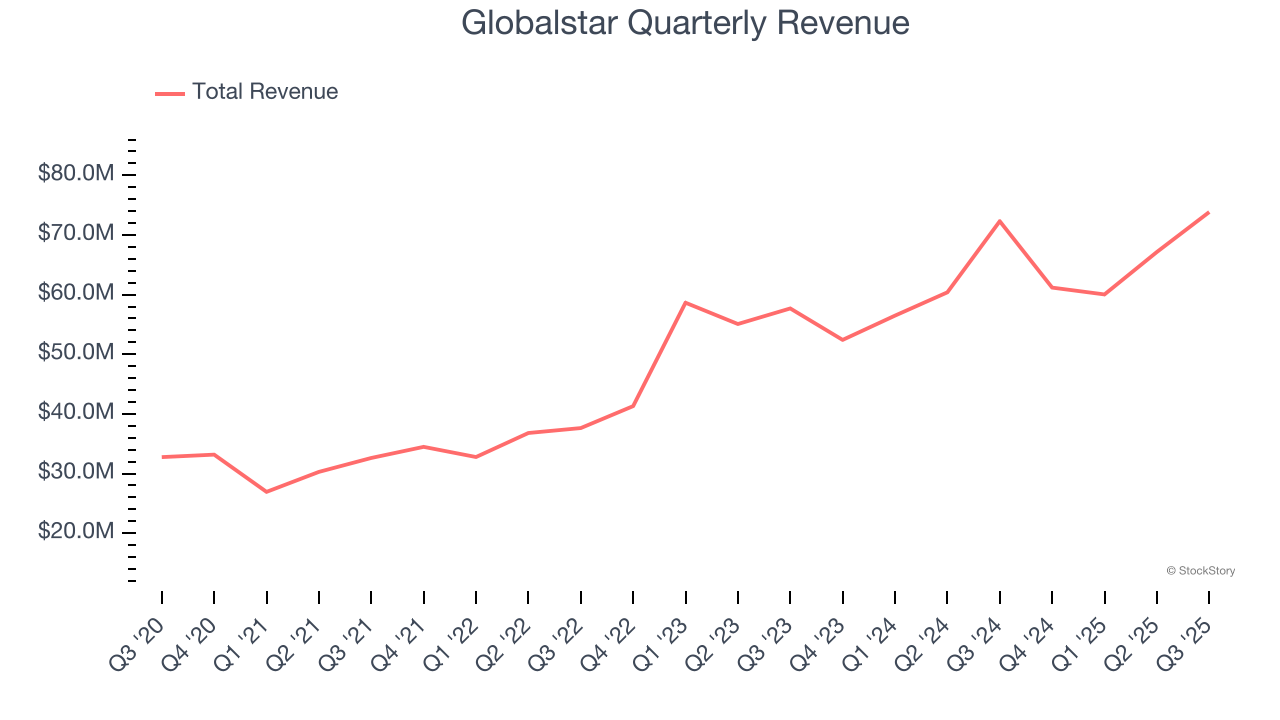
We at StockStory place the most emphasis on long-term growth, but within business services, a half-decade historical view may miss recent innovations or disruptive industry trends. Globalstar’s annualized revenue growth of 11% over the last two years is below its five-year trend, but we still think the results suggest healthy demand. 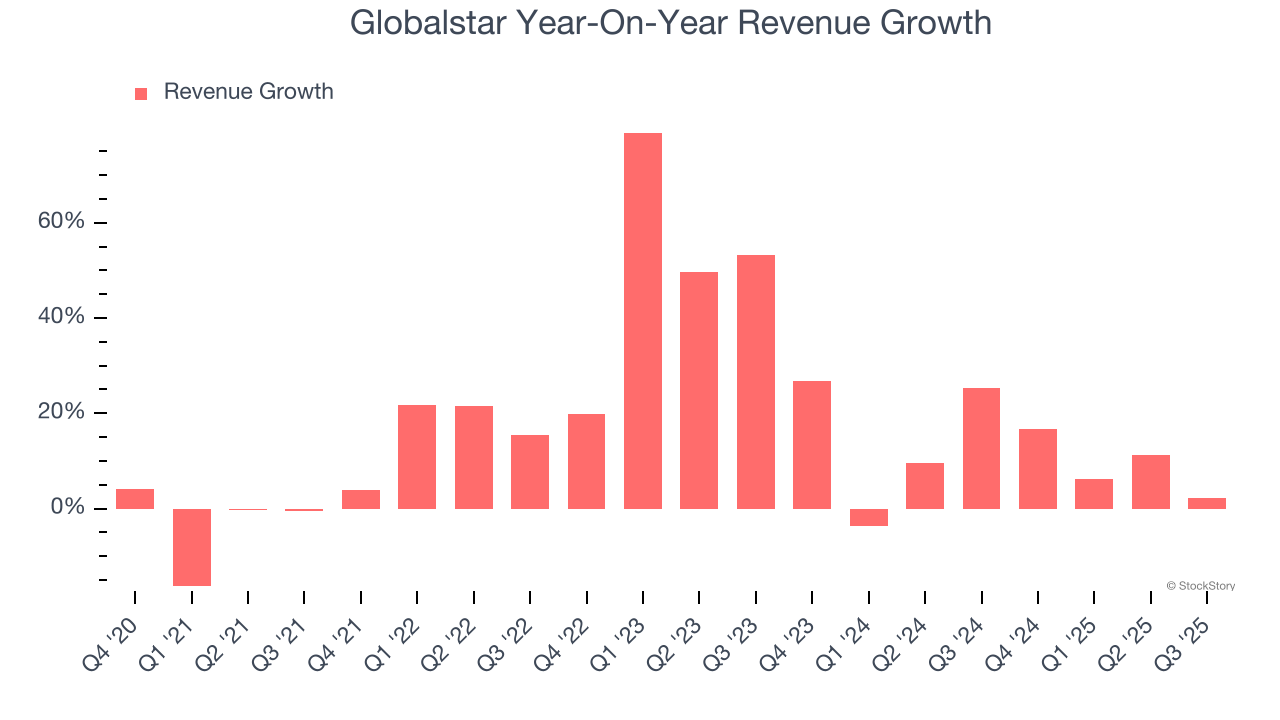
This quarter, Globalstar reported modest year-on-year revenue growth of 2.1% but beat Wall Street’s estimates by 7.1%.
Looking ahead, sell-side analysts expect revenue to grow 4% over the next 12 months, a deceleration versus the last two years. This projection is underwhelming and suggests its products and services will face some demand challenges. At least the company is tracking well in other measures of financial health.
While Wall Street chases Nvidia at all-time highs, an under-the-radar semiconductor supplier is dominating a critical AI component these giants can’t build without. Click here to access our free report one of our favorites growth stories.
Operating Margin
Although Globalstar was profitable this quarter from an operational perspective, it’s generally struggled over a longer time period. Its expensive cost structure has contributed to an average operating margin of negative 12.6% over the last five years. Unprofitable business services companies require extra attention because they could get caught swimming naked when the tide goes out.
On the plus side, Globalstar’s operating margin rose by 58.1 percentage points over the last five years, as its sales growth gave it operating leverage. Still, it will take much more for the company to show consistent profitability.
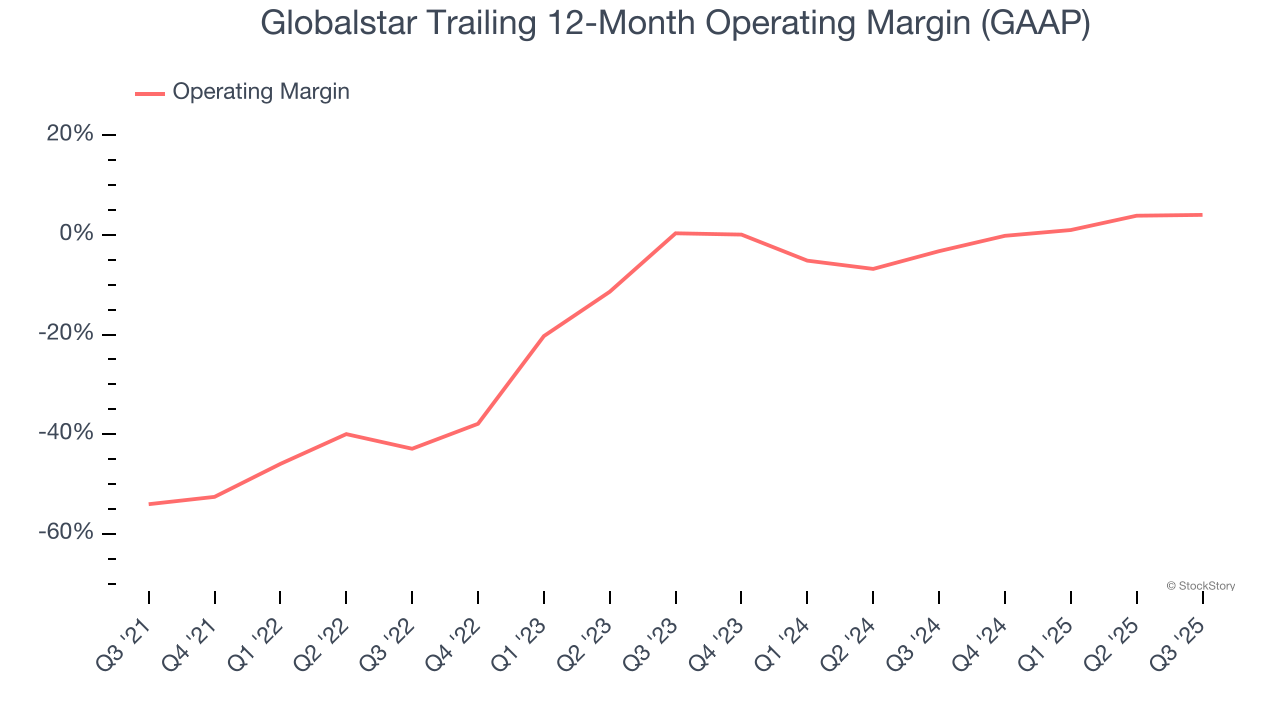
This quarter, Globalstar generated an operating margin profit margin of 13.8%, in line with the same quarter last year. This indicates the company’s overall cost structure has been relatively stable.
Earnings Per Share
Revenue trends explain a company’s historical growth, but the long-term change in earnings per share (EPS) points to the profitability of that growth – for example, a company could inflate its sales through excessive spending on advertising and promotions.
Although Globalstar’s full-year earnings are still negative, it reduced its losses and improved its EPS by 15.2% annually over the last five years. The next few quarters will be critical for assessing its long-term profitability. We hope to see an inflection point soon.
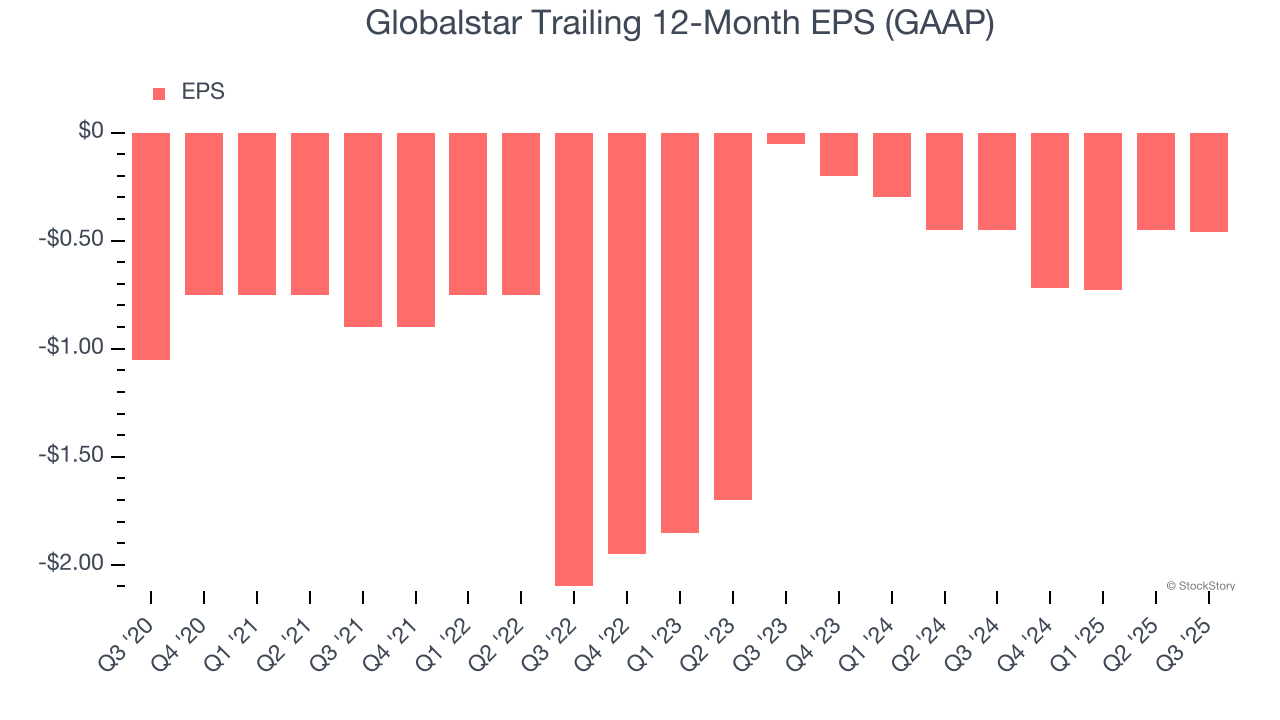
Like with revenue, we analyze EPS over a more recent period because it can provide insight into an emerging theme or development for the business.
For Globalstar, its two-year annual EPS declines of 200% mark a reversal from its (seemingly) healthy five-year trend. These shorter-term results weren’t ideal, but given it was successful in other measures of financial health, we’re hopeful Globalstar can return to earnings growth in the future.
In Q3, Globalstar reported EPS of negative $0.01, down from $0 in the same quarter last year. Despite falling year on year, this print easily cleared analysts’ estimates. Over the next 12 months, Wall Street is optimistic. Analysts forecast Globalstar’s full-year EPS of negative $0.46 will reach break even.
Key Takeaways from Globalstar’s Q3 Results
It was good to see Globalstar beat analysts’ EPS expectations this quarter. We were also excited its revenue outperformed Wall Street’s estimates by a wide margin. Zooming out, we think this quarter featured some important positives. The stock traded up 3.2% to $49.75 immediately after reporting.
Globalstar had an encouraging quarter, but one earnings result doesn’t necessarily make the stock a buy. Let’s see if this is a good investment. If you’re making that decision, you should consider the bigger picture of valuation, business qualities, as well as the latest earnings. We cover that in our actionable full research report which you can read here, it’s free for active Edge members.