

Welding and cutting equipment manufacturer ESAB (NYSE:ESAB) beat Wall Street’s revenue expectations in Q2 CY2025, with sales up 1.2% year on year to $715.6 million. Its non-GAAP profit of $1.36 per share was 1% above analysts’ consensus estimates.
Is now the time to buy ESAB? Find out by accessing our full research report, it’s free.
ESAB (ESAB) Q2 CY2025 Highlights:
- Revenue: $715.6 million vs analyst estimates of $707.2 million (1.2% year-on-year growth, 1.2% beat)
- Adjusted EPS: $1.36 vs analyst estimates of $1.35 (1% beat)
- Adjusted EBITDA: $143.5 million vs analyst estimates of $136 million (20.1% margin, 5.5% beat)
- Management slightly raised its full-year Adjusted EPS guidance to $5.23 at the midpoint
- EBITDA guidance for the full year is $530 million at the midpoint, in line with analyst expectations
- Operating Margin: 15.2%, down from 16.9% in the same quarter last year
- Free Cash Flow Margin: 5.2%, down from 10.5% in the same quarter last year
- Organic Revenue fell 1% year on year (0.9% in the same quarter last year)
- Market Capitalization: $8 billion
Company Overview
Having played a significant role in the construction of the iconic Sydney Opera House, ESAB (NYSE:ESAB) manufactures and sells welding and cutting equipment for numerous industries.
Revenue Growth
A company’s long-term performance is an indicator of its overall quality. Any business can put up a good quarter or two, but the best consistently grow over the long haul. Unfortunately, ESAB’s 3.9% annualized revenue growth over the last four years was sluggish. This fell short of our benchmark for the industrials sector and is a poor baseline for our analysis.
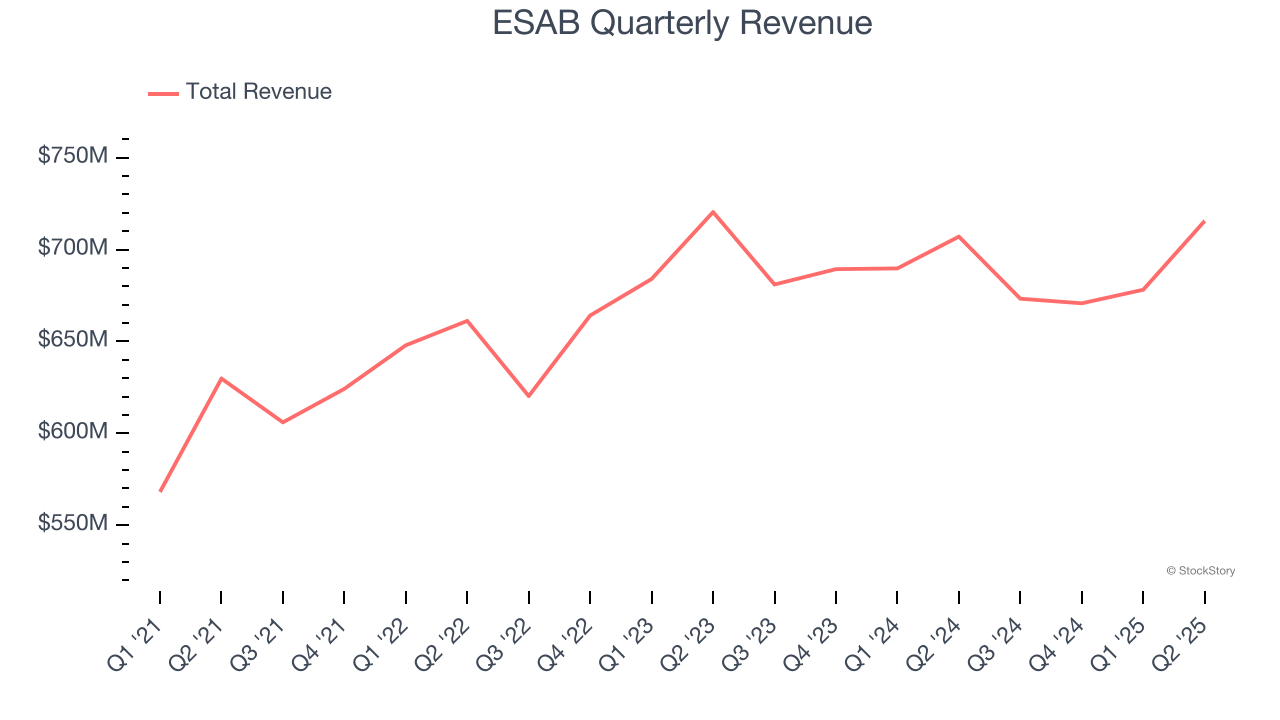
We at StockStory place the most emphasis on long-term growth, but within industrials, a stretched historical view may miss cycles, industry trends, or a company capitalizing on catalysts such as a new contract win or a successful product line. ESAB’s recent performance shows its demand has slowed as its revenue was flat over the last two years. 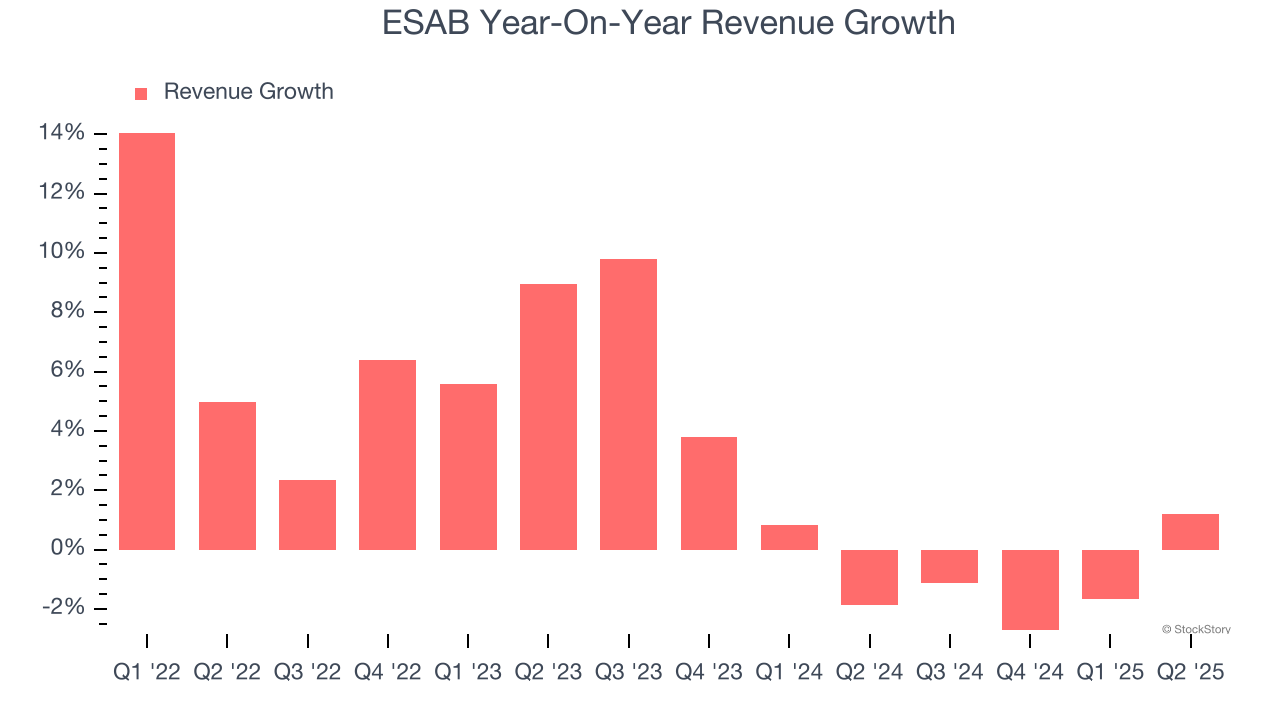
ESAB also reports organic revenue, which strips out one-time events like acquisitions and currency fluctuations that don’t accurately reflect its fundamentals. Over the last two years, ESAB’s organic revenue averaged 1.8% year-on-year growth. Because this number aligns with its two-year revenue growth, we can see the company’s core operations (not acquisitions and divestitures) drove most of its results. 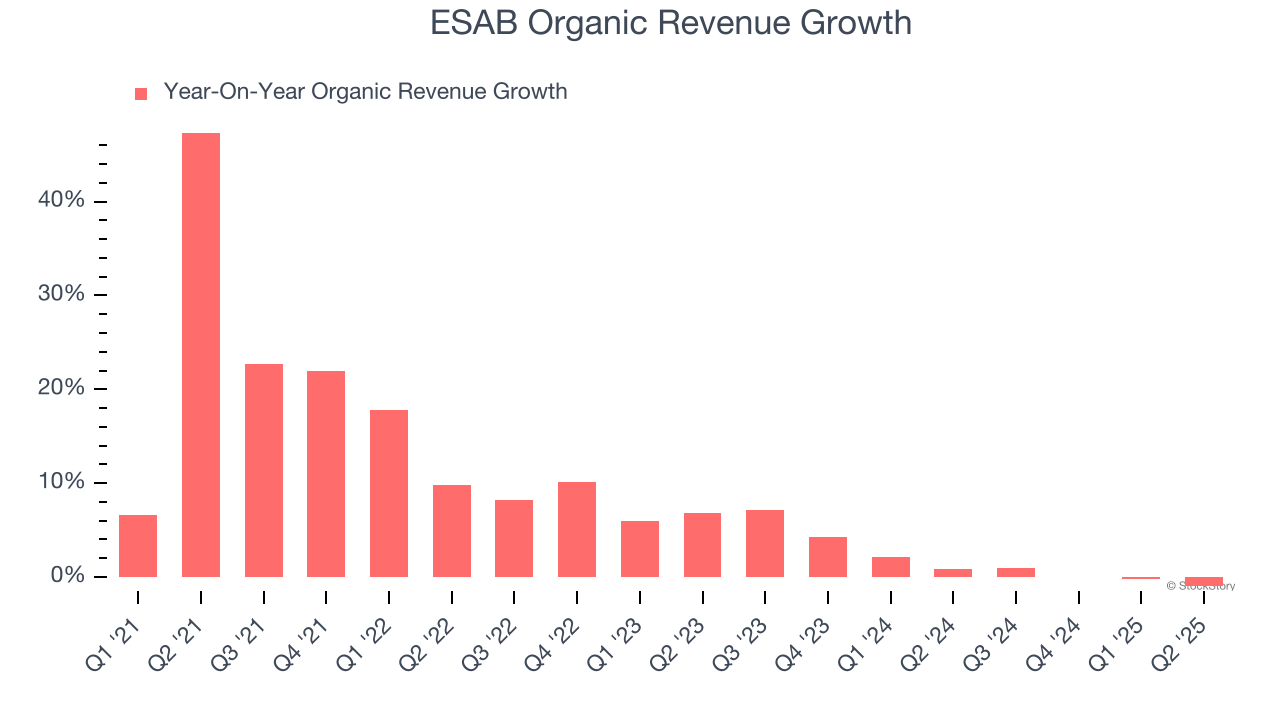
This quarter, ESAB reported modest year-on-year revenue growth of 1.2% but beat Wall Street’s estimates by 1.2%.
Looking ahead, sell-side analysts expect revenue to grow 4.2% over the next 12 months. While this projection implies its newer products and services will fuel better top-line performance, it is still below the sector average.
Unless you’ve been living under a rock, it should be obvious by now that generative AI is going to have a huge impact on how large corporations do business. While Nvidia and AMD are trading close to all-time highs, we prefer a lesser-known (but still profitable) stock benefiting from the rise of AI. Click here to access our free report one of our favorites growth stories.
Operating Margin
ESAB has been an efficient company over the last five years. It was one of the more profitable businesses in the industrials sector, boasting an average operating margin of 14.3%. This result isn’t surprising as its high gross margin gives it a favorable starting point.
Analyzing the trend in its profitability, ESAB’s operating margin rose by 2.8 percentage points over the last five years, as its sales growth gave it operating leverage.
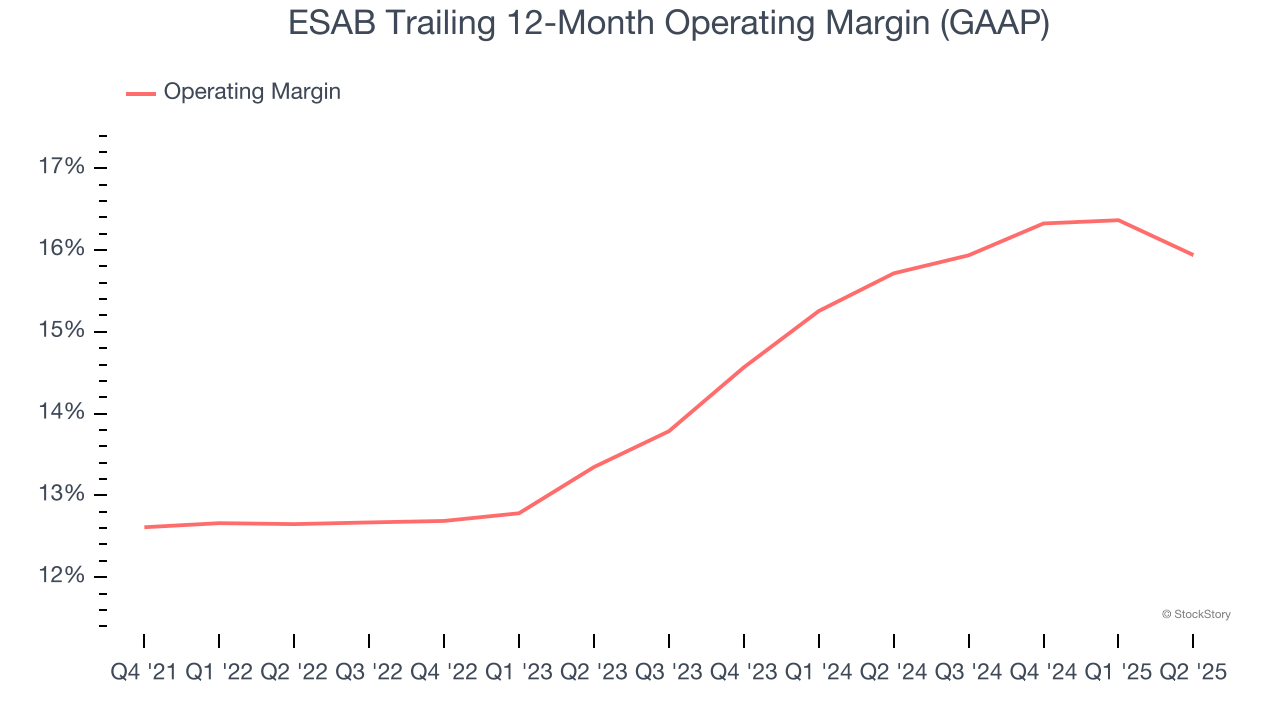
This quarter, ESAB generated an operating margin profit margin of 15.2%, down 1.6 percentage points year on year. Since ESAB’s operating margin decreased more than its gross margin, we can assume it was less efficient because expenses such as marketing, R&D, and administrative overhead increased.
Earnings Per Share
Revenue trends explain a company’s historical growth, but the long-term change in earnings per share (EPS) points to the profitability of that growth – for example, a company could inflate its sales through excessive spending on advertising and promotions.
ESAB’s weak 3.2% annual EPS growth over the last four years aligns with its revenue performance. On the bright side, this tells us its incremental sales were profitable.
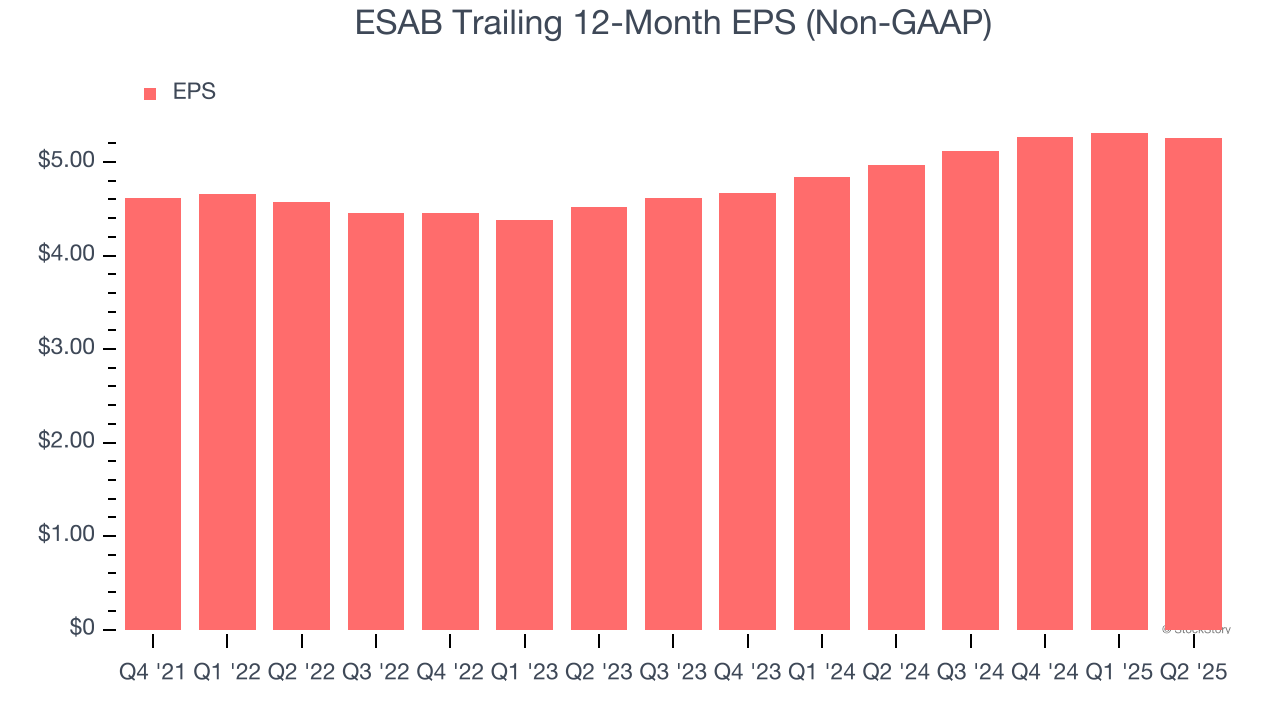
Like with revenue, we analyze EPS over a shorter period to see if we are missing a change in the business.
For ESAB, its two-year annual EPS growth of 7.9% was higher than its four-year trend. Accelerating earnings growth is almost always an encouraging data point.
In Q2, ESAB reported adjusted EPS at $1.36, down from $1.41 in the same quarter last year. Despite falling year on year, this print beat analysts’ estimates by 1%. Over the next 12 months, Wall Street expects ESAB’s full-year EPS of $5.26 to grow 10.3%.
Key Takeaways from ESAB’s Q2 Results
We enjoyed seeing ESAB beat analysts’ EBITDA expectations this quarter. We were also happy its revenue narrowly outperformed Wall Street’s estimates. On the other hand, its organic revenue was in line. Overall, this print had some key positives. The stock traded up 2% to $134.67 immediately following the results.
Is ESAB an attractive investment opportunity at the current price? When making that decision, it’s important to consider its valuation, business qualities, as well as what has happened in the latest quarter. We cover that in our actionable full research report which you can read here, it’s free.